Cambodia Reflection
Seeing as it was the first seminar that successfully took place in our class, I think that the group did a great job. The slide show made it really easy for the class to keep up with what the group was talking about. Through this presentation I was able to learn more about Cambodia. The main thing that is affecting Cambodia’s growth at the moment are the arguments going on between Thailand and Cambodia. With this disruption, the percent of people in poverty has risen and cased people to become less productive. This chain reaction has lead to various barriers to growth.
Test Reflection Section 4
I think I did a good job with the explain of the question. I think the organization was particularly good because I restated the question in the first sentence. I think I had troubles organizing my ideas when I began incorporating the diagrams. I drew two diagrams (looking from each countries point of view). Because of this, I did not refer to one of the diagrams in my explanation. I think I should better organize my ideas before I draw the diagram.
With the evaluation, I did not hook onto the prompt in the first sentence so the paper could have been better introduced. It is important for me to incorporate real world examples. If I did this, there will be a chain effect in which my arguments would be better organized because I can refer directly to the countries and the currencies.
Statistical Analysis of Laos
The GDP per capita of Laos is approximately $2400 in 2010. This places Laos in 180th in comparison to the world. There is a steady increase of $100 since 2008.
The population growth rate is approximately 1.712% in 2010. This is ranked 72nd in comparison to the world.
The unemployment rate is approximately 2.5% in 2009. This is ranked 21s in the world.
Laos exports about $1.215 billion and imports about $1.504 billion. Exports are ranked 146th and imports are ranked 161st. They export wood products, coffee, electricity, tin, copper, and gold. They import machinery and equipment, vehicles, fuel, and consumer goods. Their main trading partners include Thailand, China, Vietnam, and the UK.
All the rankings are quite low. They have a low per capita income, high population growth, moderate unemployment rate, and they are in deficit.
Using an appropriate diagram, explain who gains and who loses from the introduction of a tariff
1) Demands of the question (Time)
a. Draw tariff diagram
b. Identify stakeholders when a tariff is imposed
c. List out the pros and cons of each stakeholder
d. Explain why it is a pro or a con
2) Definition: cut and paste
a. Protectionism: When the government imposes a tariff, a quota, or a subsidy in order to protect local industries from foreign industries.
b. Tariff: a duty (tax) that is placed upon imports to protect domestic industries from foreign competition and to raise revenue for the government
3) Cut and paste from triple A
a. “A tariff is a tax on imports, which can either be specific (so much per unit of sale) or ad valorem (a percentage of the price of the product). Tariffs reduce supply and raise the price of imports. This gives domestic equivalents a comparative advantage. As such, tariffs are distorting the market forces and may prevent consumers from gaining the benefit of all the advantages of international specialisation and trade.”
4) Bullet points of this
a. “Tariffs reduce supply and raise the price of imports”
b. “domestic equivalent a comparative advantage”
c. “prevent consumers from gaining the benefit of all the advantages of international specialization and trade”
5) Insert relevant PP slides
6) Diagram
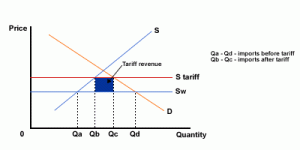
a. “The tariff has the effect of shifting the world supply curve vertically upwards by the amount of the tariff. The level of imports will fall from QaQd to QbQc. The government will also raise revenue, shown by the blue shaded area. The level of domestic production will increase from 0Qa to 0Qb.”
7) Evaluation Suggestions
– stakeholders
– pros and cons
Short-run equilibrium output (AD and AS)
 The economy is in short-run equilibrium where AD equals SRAS, and so there will be an output level of Y at a price level of P
The components of AD include consumption (C), investments (I), government spending (G), export (E), and import (M). Putting this together, it is C+I+G +(E-M).
What causes changes in AD? (shifts to the right):
Consumption: reduction in income tax
Investments: reduction in interest rates (boosts consumer spending and corporation investments
Government spending: increase in government spending (boosts demand for certain products and increases earning of that sector)
Exports/Imports: an improvement competitiveness performance (boosts exports)
JAPAN. SURPLUS or DEFICIT? (via Moeko IB Economics Year 1’s Blog)
This is a blog post which illustrates the current account deficit in Japan.
The J-Curve
 The country has a current account deficit when it is at the starting point (the very left side of the curve) of the J curve. The exchange rate of the currency is lowered to rectify this. In the short term, because of existing contracts and imperfect knowledge, the deficit worsens to the minimum point on the curve. However, int he long term, if the Marshall-Learner condition is fulfilled, exports revenues will begin to increase and import expenditure will start to fall. The current account deficit will get smaller, moving in the positive section of the J-curve.
Subsidy
 When the government gives a subsidy to domestic producers, the domestic supply curve shifts downwards from S1 to S2. S2 represents the domestic supply with the addition of the subsidy. The price to consumers remains the same but imports will fall while domestic production will increase. Though the overall quantity supplied does not increase in terms of world supply, the ratio of imports to domestic changes.
Tariff
 This diagram illustrates the effect of imposing a tariff. In this case, we are looking at a tariff imposed on the imports of Chinese paper into the European Union. A tariff is a tax that is imposed on each unit of import brought into the country. Because the price has increased, China will export less of their paper to the EU which causes the supply of Chinese paper to shift up. By doing so, there is a dead-weight loss as there are some competitors that will no longer be able to produce at given price level P1. This is represented by the orange coloured area. Also, the blue section represents the government revenue which is gathered from the tax.
Free Trade
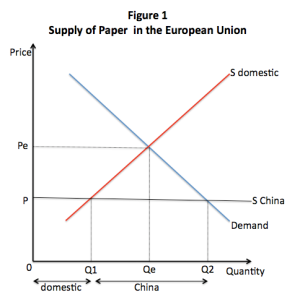
 This diagram illustrates the supply of paper in the European Union. In this case, the European Union is importing paper from China. Because there are imports, there is a kink in the supply of paper. The quantity supplied by the EU is represented by 0 to Q1 whereas the quantity supplied by foreigners or, in this case, China, is Q1 to Q2.
-
Archives
- March 2011 (1)
- February 2011 (2)
- January 2011 (1)
- December 2010 (13)
- November 2010 (2)
- October 2010 (3)
- August 2010 (3)
- May 2010 (2)
- April 2010 (4)
- March 2010 (4)
- February 2010 (6)
- January 2010 (3)
-
Categories
-
RSS
Entries RSS
Comments RSS

